Guides
Monitor Self-Hosted AI Services with Uptime, Logs, and Metrics
Track availability, latency, and failures so your AI stack stays trustworthy and maintainable.
Monitor Self-Hosted AI Services with Uptime, Logs, and Metrics
If you cannot see when your AI stack is unhealthy, you will only notice when users complain. Basic monitoring gives you enough visibility to catch outages, performance regressions, and suspicious behaviour before they become bigger problems.
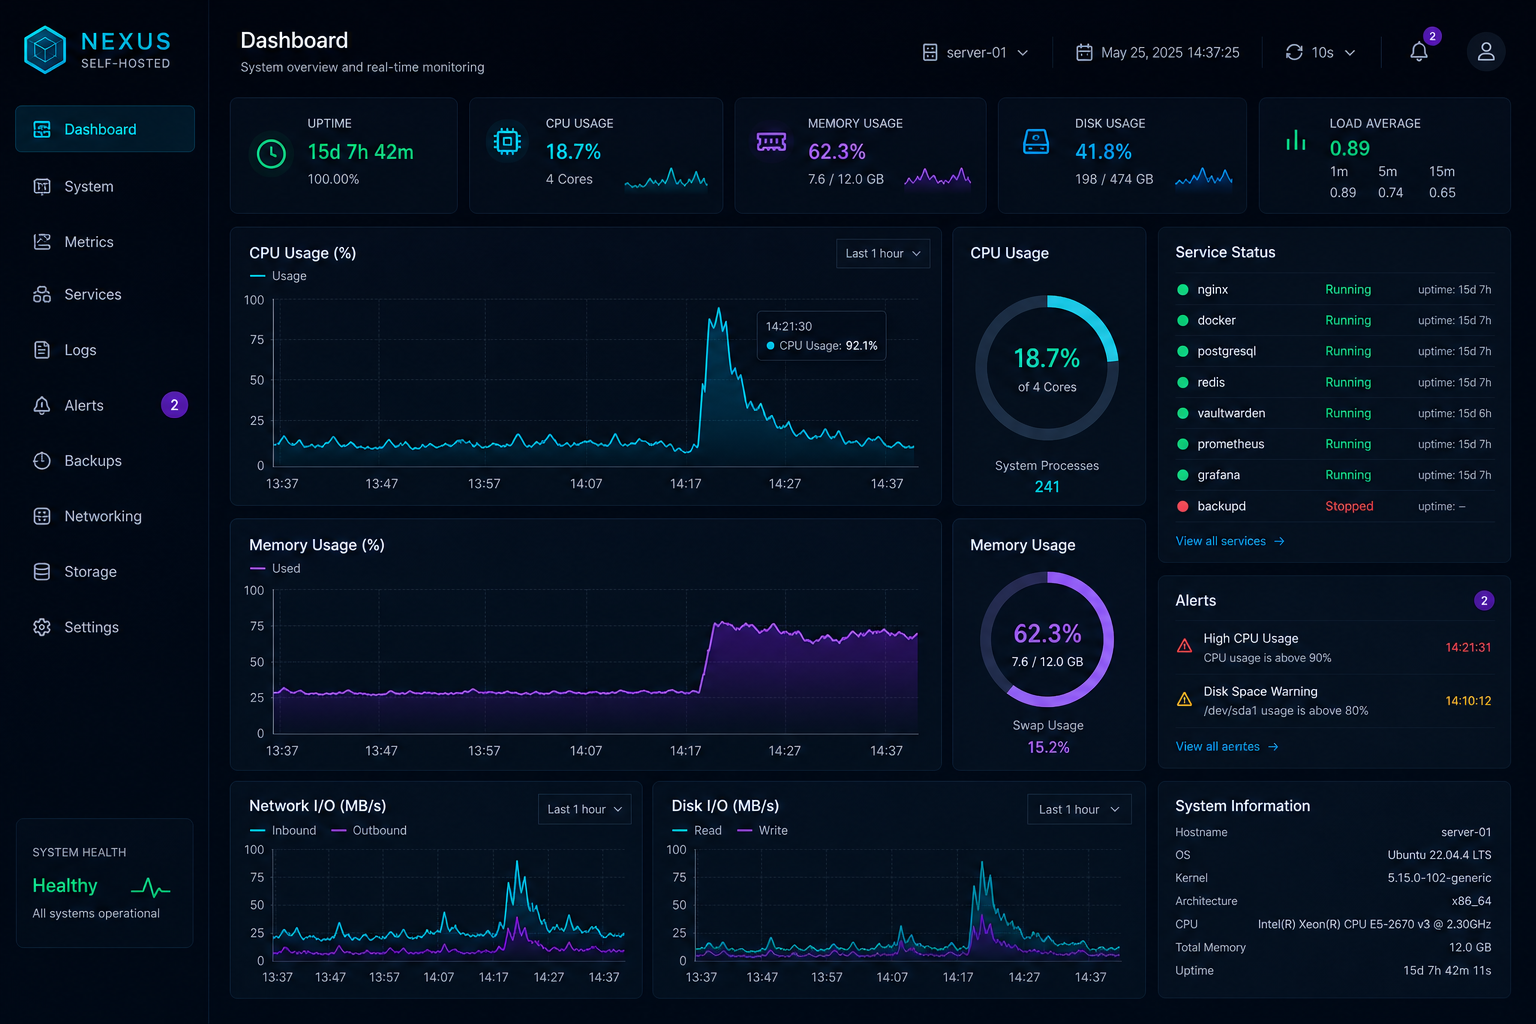
Track the essentials first
Start with uptime, response time, CPU, memory, disk, and GPU usage. Those signals tell you whether the service is alive, overloaded, or slowly failing.
Log what matters
Keep access logs, error logs, and application logs, but make them searchable. Repeated auth failures, long request times, and restart loops are often the first signs of trouble.
For dashboard exposure, pair your setup with Restrict Access to Private AI Dashboards with VPN and SSO so monitoring stays inside the private perimeter.
Watch data services too
RAG systems depend on databases, indexes, and document stores as much as they depend on the model. Monitoring should include the supporting services, not only the chat UI.
For a retrieval-heavy stack, see Build a Local RAG Pipeline That Actually Answers Questions and apply the same care to the database and search layer.
Conclusion
Monitoring is a habit, not a project. Keep the signal small, useful, and private, and your self-hosted AI environment becomes much easier to operate.
FAQ
Do I need a complex observability stack?
No. A small set of uptime checks, logs, and metrics is often enough.
What should trigger an alert?
Downtime, repeated auth failures, disk pressure, and GPU exhaustion are good starting points.
Should logs include prompts?
Only with care. Prompts may contain sensitive information, so collect the minimum needed for debugging.


