Guides
Monitoring Checklist for Self-Hosted AI Services
Track uptime, logs, latency, and disk pressure so your AI services fail loudly instead of silently.
Monitoring Checklist for Self-Hosted AI Services
If a service is important enough to run, it is important enough to observe. Monitoring does not need to be huge; it just needs to tell you when the stack is sick, slow, or unexpectedly busy.
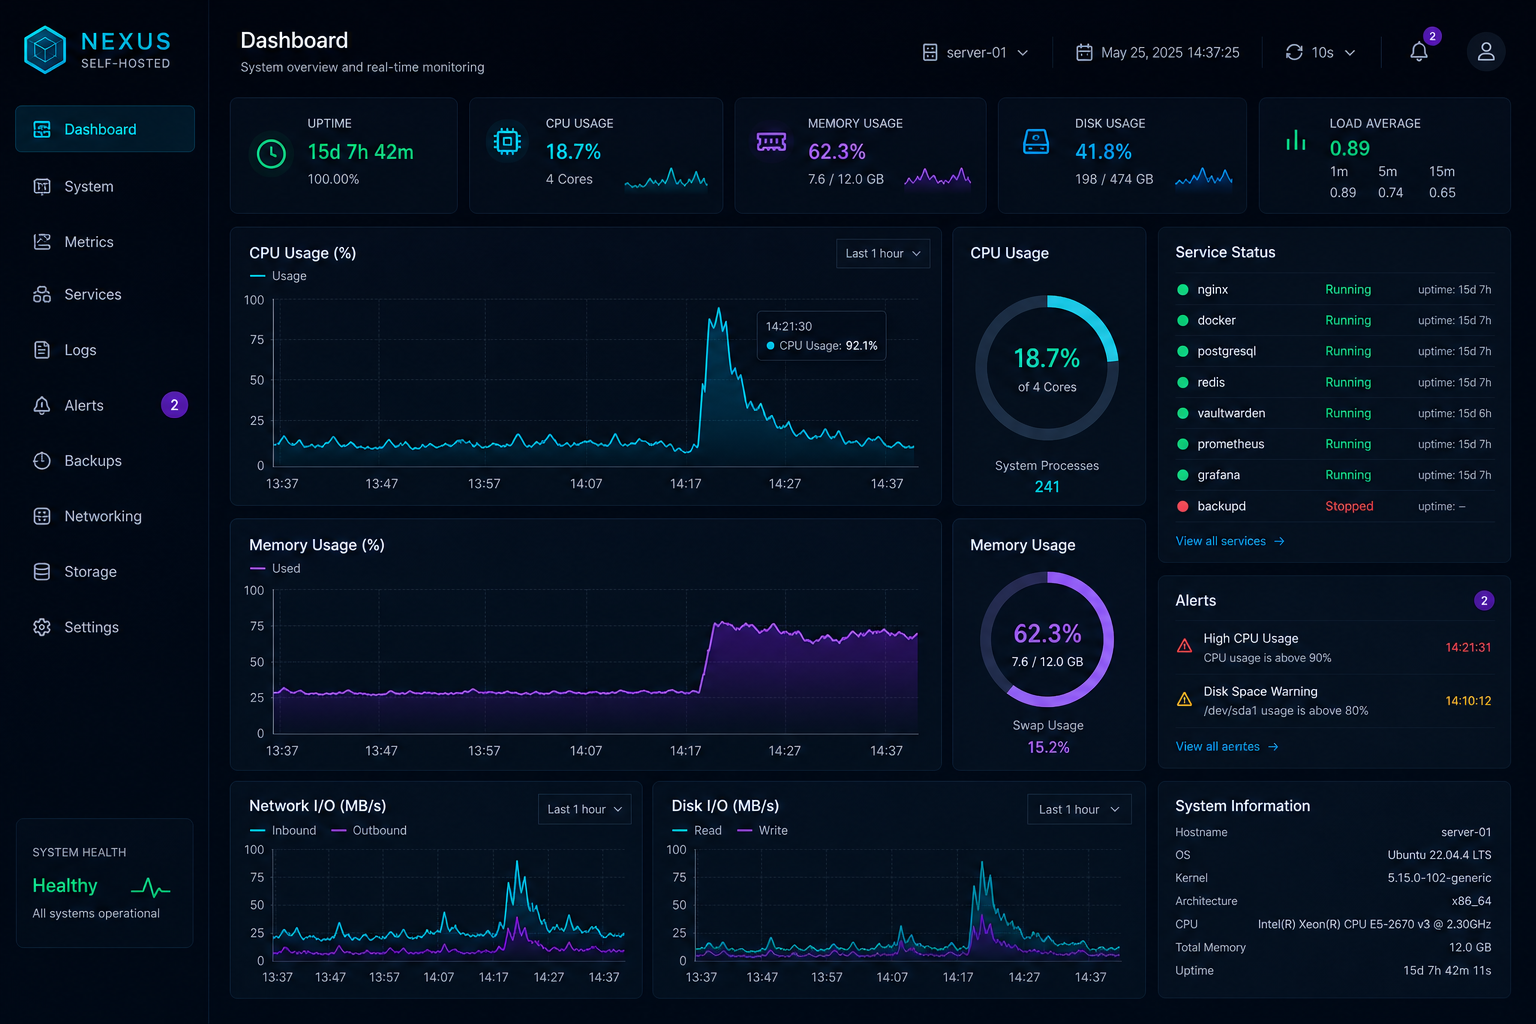
Measure the basics
Start with the ideas in Monitor Self-Hosted AI Services with Uptime, Logs, and Metrics and make sure you can see uptime, latency, CPU, memory, disk, and GPU usage.
Watch the supporting services
The UI is only part of the story. Databases, vector indexes, and document stores are often the first things to fail, so include them in the same monitoring view.
Turn signals into action
Alerts should be rare and useful. If every minor slowdown creates noise, people will stop trusting the system. Tie the thresholds to the recovery steps in Build an Incident Response Plan for Your Self-Hosted AI Stack.
Keep security signals visible
Repeated login failures, unexpected public traffic, and unusual route access are worth tracking too. When paired with Caddy Access Controls for Self-Hosted AI Dashboards, monitoring becomes part of your access control story.
Conclusion
The best monitoring is simple, private, and actionable. If you can spot outages and bad behaviour early, the rest of the stack becomes much easier to run.


